
To run a high-performing dealership or OEM network today, you need more than just experience. Indian OEMs face a market shaped by online buyers, electric vehicle growth, more competition, and shorter attention spans. As a result, monitoring performance, real-time data, and good operations are now a must, especially with modern OEM Dealer Network KPIs guiding decisions.
And to this, OEMs need to measure a few KPIs. The correct KPIs let OEMs and their dealers track how they’re doing, improve operations and profits, and fix issues before they lose market share. No matter if you’re a big company, a farm equipment maker, or a machinery brand with many distributors, your dealer teams need data that leads to action. These insights play a big role in OEM performance monitoring and long-term network success.
Here are the 10 most important KPIs for dealer networks, followed by four key areas OEMs should use to manage and grow their dealer networks.
Top 10 KPIs Every OEM Should Monitor for High Performance in 2026 and Beyond
1. Inventory Turnover
If there’s a KPI that shows how alive your business really is, it’s inventory turnover. IT metric shapes your cash flow, boosts your profits, and keeps your working capital from getting stuck on the shelf, a critical measure in the KPI automotive industry landscape.
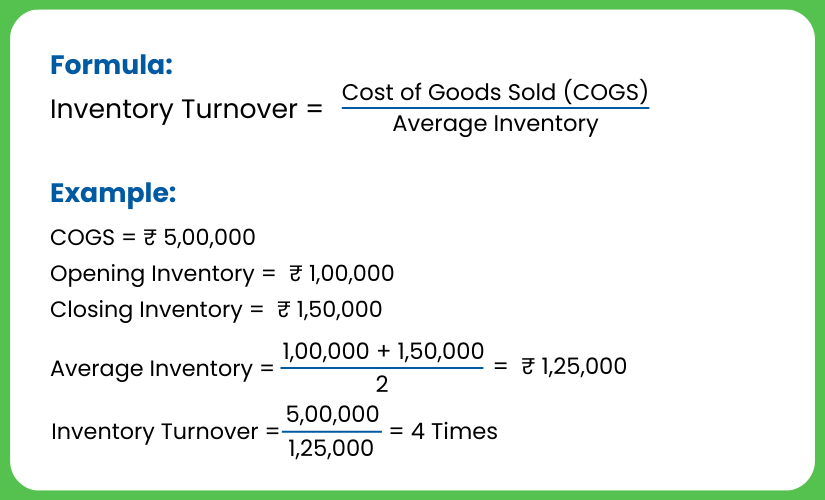
Why It’s Important for OEM Dealer Networks:
Quick turnover means you have the right products and good inventory management. Slow turnover means you may have pricing problems, too much stock, regional mismatches, or low demand. This makes it an essential part of Dealer Network KPIs.
What OEMs Should Do:- Track turnover by model, type, and region.
- Find dealers with slow-moving stock.
- Offer deals or inventory swaps.
- Start with this to monitor OEM performance using OEM performance monitoring best practices.
2. Gross Profit Per Unit (GPU)
GPU shows how profitable and healthy a dealership is, a classic KPI for automotive industry operations.
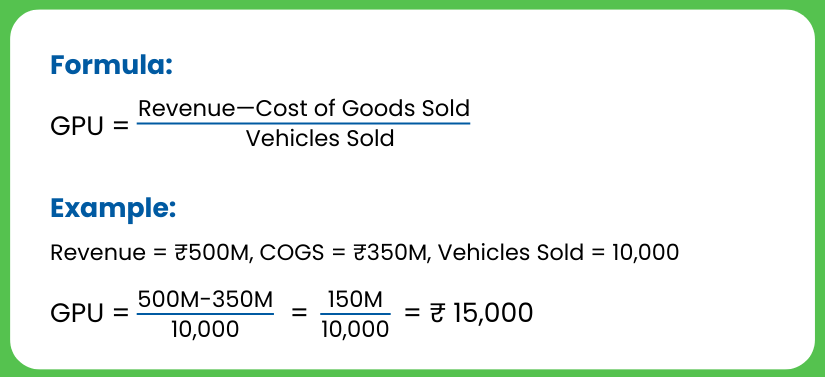
A good GPU keeps dealers motivated, stable, and invested in the brand.
Why It Matters for Dealerships:
- Helps with competitive pricing that still makes a profit
- Helps fine-tune discounts
- Shows how well each model is doing
- Supports strategic planning in OEM Dealer Management System analytics
3. Customer Satisfaction Score (CSAT)
CSAT metric helps OEMs by showing how customers feel about a dealership’s sales or service.
How to Measure:Customer surveys after a purchase or service.
High CSAT means your dealers are doing well, while low CSAT shows issues with sales, delivery, or service.
Why It Matters:
- Affects Net Promoter Score (NPS)
- Increases referrals and repeat sales
- Shows dealership culture and customer service skills
- CSAT is now a must-track Dealer Network KPIs measure
OEMs tracking CSAT can find problem areas and offer training using insights from an AI-Powered DMS for OEMs.
4. Service Efficiency
Service often brings in over 40% of a dealership’s profit, so this is an important thing in the KPI automotive industry.
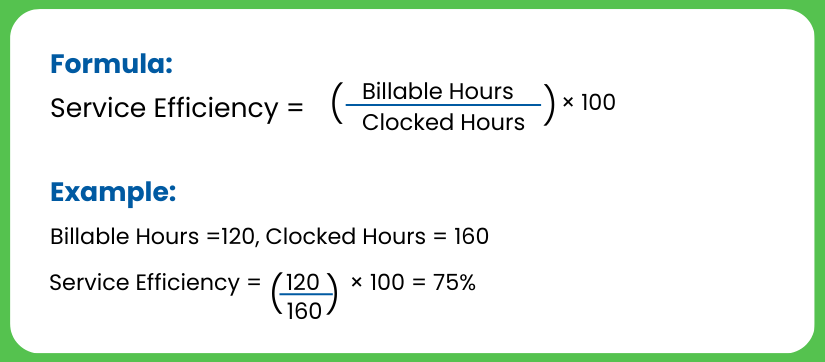
Key Metrics to Track:
- Technician work rate
- Job time
- Service appointments
- Workshop use
OEMs should also track service levels, first-service visits, and repeat service. This shows real customer experience, not just sales, as an important aspect of performance monitoring.
5. Lead Conversion Rate
Marketing can bring in leads, but its real impact shows when dealers actually convert them. This is one of the most important KPI for automotive industry metrics.
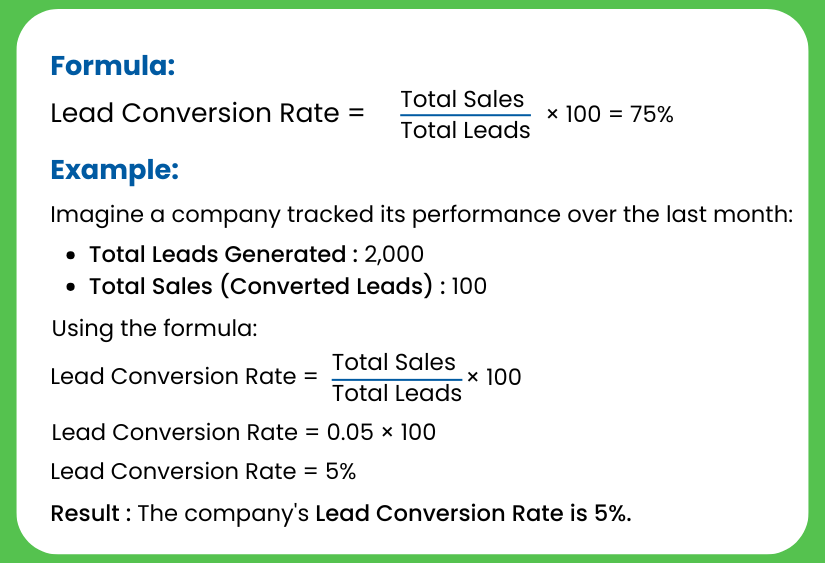
Why It Matters:
- Affects sales
- Shows problems in follow-up
- Helps improve marketing
This KPI is key in markets like India, where most buyers start online.
6. Average Days to Sell (ADS)
This shows how long a vehicle sits before it’s sold.
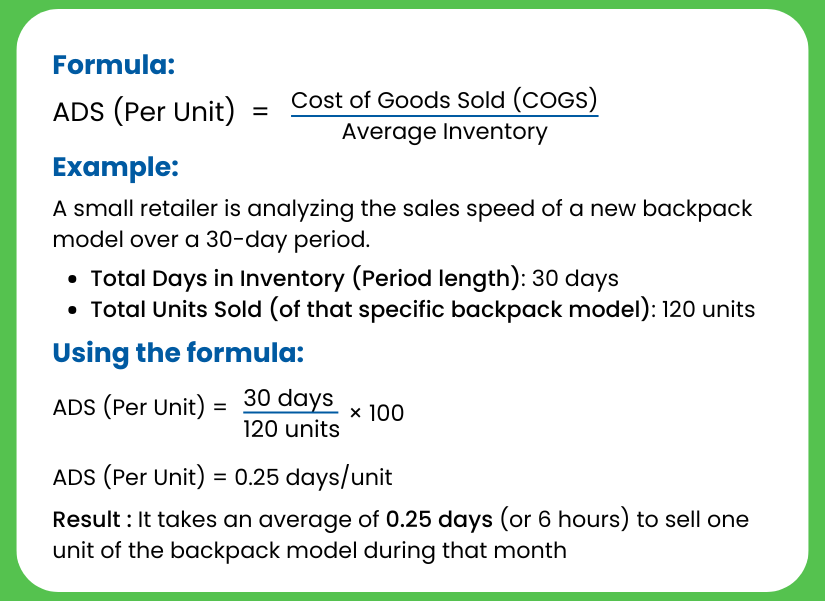
High ADS means slow demand, wrong stock, or poor lead handling. OEMs should check ADS by region, city, model, and even colour.
Lower ADS = better cash flow + faster income.
ADS is a major component in Dealer Network KPIs analysis.
7. F&I Revenue Per Vehicle
Finance & Insurance revenue is a big source of profit, also tracked inside every modern OEM Dealer Management System.

In India, this includes loans, accessories, and warranties. Tracking this KPI lets OEMs see how well dealers are selling and pushing accessories.
8. Employee Efficiency
Staff work rate affects sales speed and service.
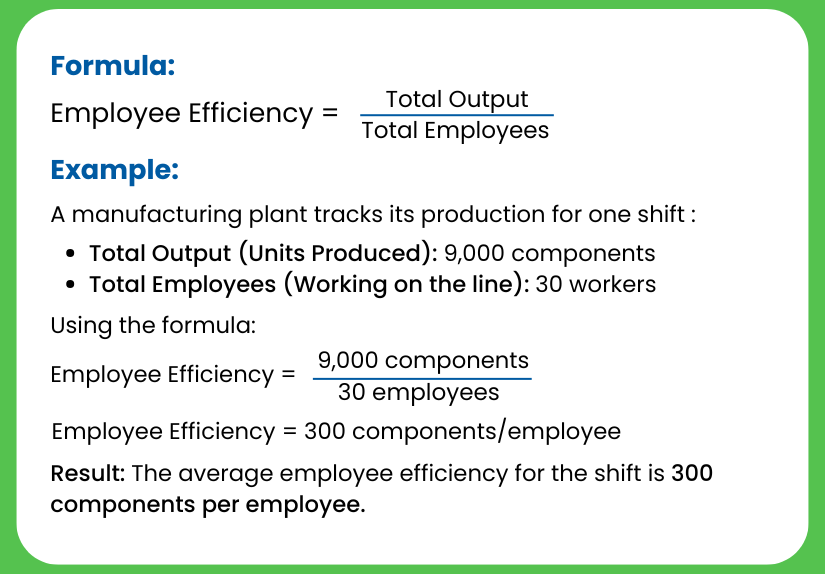
OEMs should track:
- Sales per person
- Calls per person
- Test drives per day
- Service jobs per technician
This helps find underperforming locations and is supported by AI-Powered DMS for OEMs using smart automation.
9. Net Promoter Score (NPS)
NPS is the base of brand loyalty. It connects directly to customer experience, a central pillar of OEM performance monitoring.
Formula:NPS = % Promoters − % Detractors
Promoters (9–10) minus detractors (0–6) equals the score.
NPS predicts future sales and service, making it key for OEMs and a major KPI in the automotive industry benchmark.
10. Operating Expense Ratio
This measures how well a dealership controls costs.
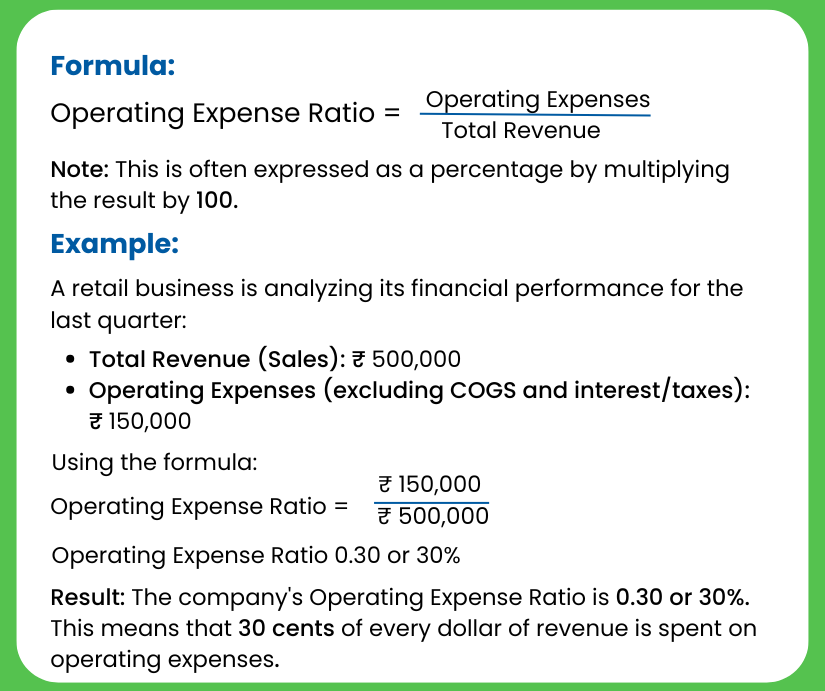
OEMs watching this KPI can spot struggling dealerships and prevent issues through their OEM Dealer Management System dashboards.
Why Businesses Choose NetFlows360
NetFlows360 is tailored for Indian OEMs because it addresses the specific needs of India’s automotive market:
Modules- Pre Sales & Sales Management: Streamlines lead tracking and dealer network management across diverse regions.
- Service & Inventory Management: Ensures smooth post-sales service, warranty handling, and spare parts availability.
- Accounting & Finance Management: Compliant with Indian systems, GST etc.
- Dashboards & Reports: Provides actionable insights for sales, service, and inventory performance.
- AI-Powered Business Insights: Predicts sales trends and optimizes operations in India’s fragmented market.
- Build Your Team (BYT): Supports flexible workforce needs.
- Call Center & E-Catalog Integration: Enhances customer support and digital E-catalog management.
In Conclusion
In a market with changing demand, rising customer needs, and growing digital use, OEMs can’t rely on old methods. The way to grow is by using KPIs that show problems early, improve dealer teams, and turn chaos into success.
The right KPIs let OEMs and dealers act faster and build a strong future. To get the most from them, you need a connected system that links your whole network in real time, the role of modern OEM Dealer Management System tools.
FAQs
If you want a clear view of the dealer network’s performance, track a few essentials: Speed-to-Contact, Lead-to-Sale Conversion, Delivery and Ownership NPS, Gross Profit Per Unit (GPU), and Service Absorption, all part of core OEM Dealer Network KPIs.
Operational KPIs: daily/weekly
Financial KPIs: monthly/quarterly
Most OEMs use automated performance monitoring via AI systems.
A good KPI is measurable, clear, and aligned with results like demand, customer experience, and sales, a foundation of the KPI for the automotive industry framework.
Yes. Even smaller OEMs can start with basic KPIs and then add more with a system like NetFlows360, an AI-Powered DMS for OEMs built for any scale.